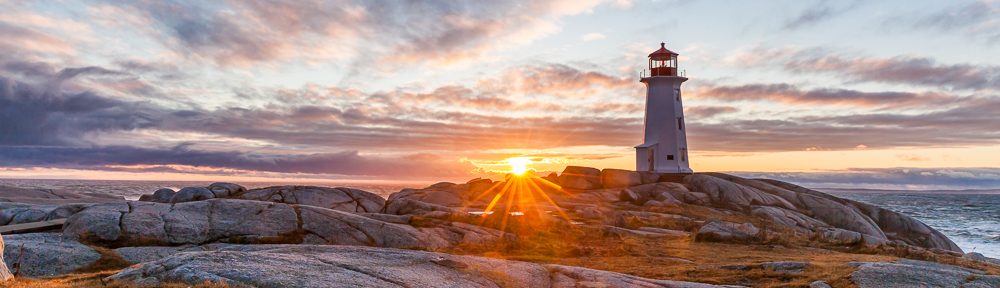
When looking at a captured image on the back of your camera’s display the perceived brightness is influenced by the brightness setting of the display and the ambient light (the light around us). For example, on a bright sunny day looking at the display on the back of your camera is hard to even see the image verses viewing the display on a cloudy day where you are able to see the image easily. It is therefore not possible to see an accurate representation by just viewing the captured image on the display to determine if it is properly exposed.
 Viewing the “histogram” for a captured image is a consistent method of determining if it is properly exposed. The histogram is basically a graph of the number of pixels versus the brightness of those pixels in your image. First we will discuss just the “luminance” part of the graph which represents the image brightness scale at the bottom horizontal part of the graph with 0% brightness (black) on the left through 50% brightness all the way to 100% brightness (white) on the right. The number of pixels in the image with their specific brightness’s are shown on the left side scale vertically throughout the graph starting at 0 on the bottom to the maximum number of pixels at the top.
The most important part of the histogram is the most left black area and the most right white areas which are referred to as the clipping points. The “clipping point” means if you hit the minimum value of 0% brightness it will be pure black, and conversely if you hit the maximum value of 100% brightness it will be pure white. Once you reach the clipping point there will be no detail in that part of the image. For example, the sky on a clear bright day should be light blue, if the captured image is over exposed the sky will be white because the 100% brightness clipping point was reached.
By using the three colours; “red”, “green”, and “blue”, it is possible to create all the colours that you see in the captured image. Similar to “luminance“, which represents the brightness of the image as if it were in only black & white on the histogram you can also see the “RGB histogram” with individual graphs that represent each of the colours; “red“, “green“, and “blue” and their respective brightness.
It is important to understand there is no such thing as a typical or perfect histogram, they will all look different based on the subject matter of the scene you have taken an image of. Let’s take a look at a sample image to see what the actual histogram on your camera would look like.
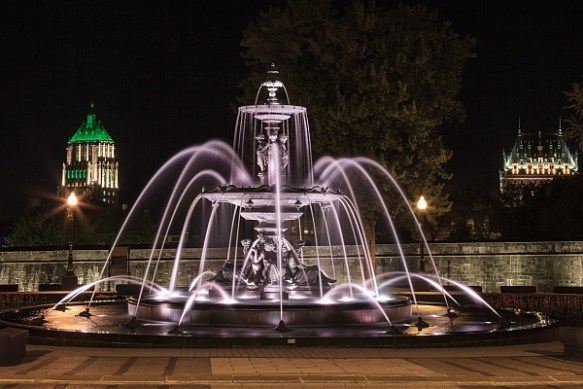
Fontaine de Tourny, Quebec, Canada, f/14, 10 sec, ISO 200, @70mm
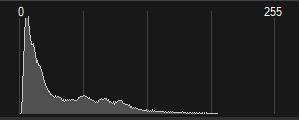
Luminance Histogram
What you typically see on your camera is the “luminance” histogram. Notice most of the concentration of pixels, for the above fountain image, is on the left side which represents the black and darker areas in the image, as you look toward the right the rest of the pixels represent the brighter parts of the image. Notice that the luminance graph does not go all the way over to the right.
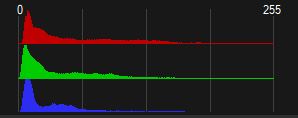
RGB Histogram
With the RGB histogram it breaks down the brightness of each of the “red”, “green” and “blue” colour pixels. It is important to notice that the “red” and “green” histogram pixels show they go all the way over to the right and are not pushed up on the right hand side which is different than what we see with the luminance histogram. This is why it is so important to view both the luninance and RGB histograms, to make sure that the luminance or any of the red, green or blue colours are not clipping. Note, not all cameras provide the capability to see the RGB Histogram.
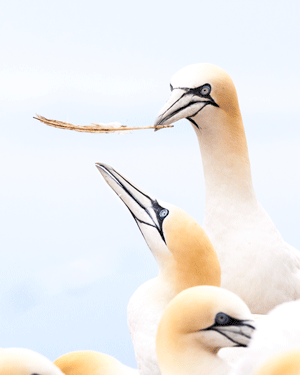
f/8, 1/2000, ISO 640, @400mm
With the difficulty in determining if the captured image is over exposed, another tool available to help is the “Highlight Alert“, typically enabled via the menu on most cameras. You will see the image displayed blink from white to black and back to white in the areas of the image that are clipping at the white point (the right hand side of the histogram). Once you have reached the highlight clipping point it will be pure white and you will no longer have detail in those areas. In this image the feather detail will be lost in the areas that are blinking.
Now that we have learned the concepts to achieve a good exposure, in our next lesson we will discuss how to get your camera to capture your image with proper colour by controlling the “white balance” settings.
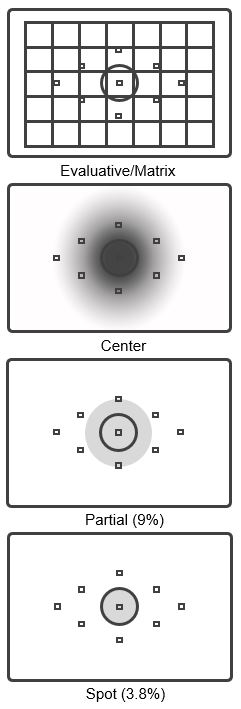 On most cameras there are at least three (3) metering modes; evaluative or matrix, spot, and center. On more advanced cameras there is also a fourth called partial metering mode.